spatial transcriptome-stereo-seq
stereo-seq, a spatio-temporal omics technology independently developed by bgi genomics, captures mrna from tissue section by stereo chips and restores the spatial context by utilizing the spatial barcode (coordinate id, cid), thus establishing a solid research foundation for further understanding the relationship between gene expression, morphology of cells and local environment.
stereo-seq is a pioneering tool that achieves nanoscale resolution: can theoretically achieve a 100% cell capture rate, obtaining more informative and accurate cell clustering results.
stereo-seq provides centimeter-scale panoramic field of view, a maximum field of view of 13 cm x 13 cm, enabling the rendering of a panoramic molecular cell map of organs and life. stereo-seq recognizes the location of the nucleus through fluorescent imaging, and in combination with the algorithm, the expression map can be achieved at approximate single-cell level.
dnbseq™ technology platforms
bgi genomics' sequencing services are typically executed with proprietary dnbseq™ sequencing technology platforms, for great sequencing data at some of the lowest costs in the industry. dnbseq™ can offer advantages in terms of lower amplification error rates and much lower duplication rates for some sequencing applications. in addition, studies have shown the lower index hopping rate in dnbseq™ platforms.
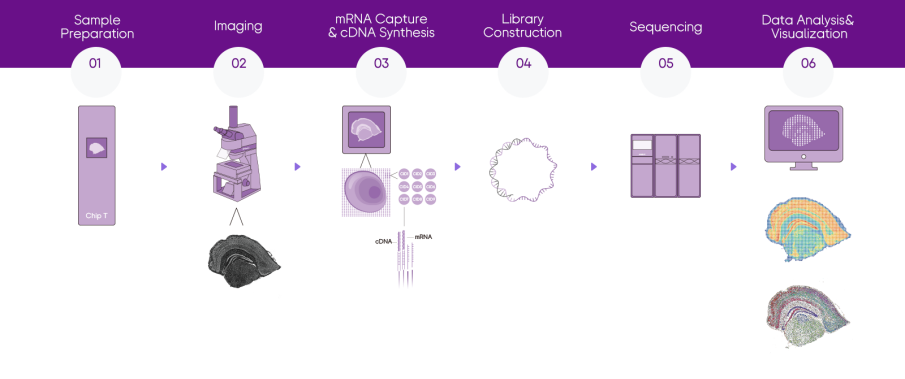
project workflow
how to order

sequencing service specification

sequencing
1. guaranteed ≥80% of bases with quality score of q30
2. dnbseq™ pe100 sequencing
3. raw data of 1g reads/sample and saw analysis are available for delivery

turnaround time
the turnaround time for 4 sample including: library construction, sequencing and saw analysis is about 25 working days; since the sample processing (slicing, sample qc, dyeing, permeabilization) steps needs extra discussion which do not count in the project execution.
sample requirement
fresh frozen samples suggest embedded in tissue-teck oct, to avoid rna degradation, we recommend performing tissue embedding within 30 minutes after resected and wiped extra fluid.
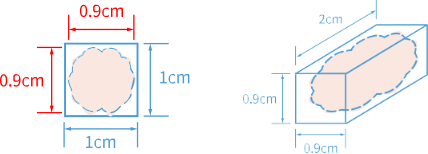
the tissue size should not exceed 0.9 cm x 0.9 cm x 2 cm, as the tissue section should not exceed 80% area coverage of the chip.
it is recommended to check the rna quality (rin value) of a tissue sample before proceeding to stereo-seq transcriptomics experiment. total rna can be extracted from 10- 20 slices of 10 µm-thick tissue sections and stored at -20°c in a pre-cooled 1.5ml ep tube. it is strongly recommended to proceed only with tissue samples with a rin value >7.
sample storage and transportation
for storing, wrap the tissue block with aluminum foil and keep it in a properly labeled sealable plastic bag to prevent dehydration and damage then store at -80°c. for transportation, please ship samples on dry ice according to local policy.
data analysis
split stereo-seq chip t mask file into several pieces according to cid indexing in the q4 fastq files.
count cids in the stereo-seq chip t mask file and roughly estimate memory required to do mapping.
correspond in situ captured sequenced reads recorded in fastq(3,4) files by stereo-seq with their spatial information. it also aligns reads to the reference genome and generates coordination sorted bam files.
combine cid (same as barcodes) listed files with reads count from multiple runs of mapping. only for an analysis that requires to combine multiple pairs of fastq.
read bam files generated from mapping to perform gene annotation, de-duplication, and gene expression analysis on the aligned reads.
align microscopic tissue staining image with gene expression matrix file (gef) generated from count. register is an optional pipeline when image fails qc or input image is absent.
convert tiff images from ipr, such as template-aligned stitched tiff image, binarized tissue segmentation and cell segmentation images. optional module when image fails qc or input image is absent.
identify tissue coverage area on the chip and extract gene expression matrix of the corresponding spatial location by taking inputs from both count and register or count pipeline alone.
perform clustering analysis for spots (bin200) according to the gene expression matrix of the tissue coverage area generated from tissuecut.
identify cell nuclei coverage area on the staining image and extract gene expression matrix of the corresponding spatial location by taking inputs from both count and register & imagetools pipeline. optional module when image fails qc or input image is absent.
adjust cell coverage region based on the aligned cell nuclei segmentation image generated from register and imagetools. then extract expression matrix of the adjusted cells in cell bin gef and gem formats.
perform clustering analysis for cell bins according to the gene expression matrix which is generated from cellcorrect. optional module when image fails qc or input image is absent.
calculate sequencing saturation of tissue coverage area based on the file that was used for sampling data generated from count.
generate a json format statistical summary report that integrates the analysis result from each step, as well as an html web analysis report, and shows spatial expression distribution of genes, key statistical metrics, sequencing saturation plots, clustering analysis results. depending on the image input state and register mode, html reports may or may not have cell bin statistical data and image processing key results.

publication
| title | publication | if | published year |
|---|---|---|---|
| a cellular hierarchy in melanoma uncouples growth and metastasis | nature | 69.504 | 2022 |
| spatiotemporal transcriptomic atlas of mouse organogenesis using dna nanoball-patterned arrays | cell | 66.85 | 2022 |
| spatiotemporal insight into early pregnancy governed by immune featured stromal cells | cell | 64.5 | 2023 |
| single-cell spatial transcriptome reveals cell-type organization in the macaque cortex | cell | 64.5 | 2023 |
| single-cell stereo-seq reveals induced progenitor cells involved inaxolotl brain regeneration | science | 63.714 | 2022 |
| identification of hsc/mpp expansion units in fetal liver by single-cell spatiotemporal transcriptomics | cell research | 46.297 | 2022 |
| an invasive zone in human liver cancer identified by stereo-seq promotes hepatocyte-tumor cell crosstalk, local immunosuppression and tumor progression | cell research | 44.1 | 2023 |
| clinical and translational values of spatial transcriptomics | signal and transduction and targeted therapy | 38.104 | 2022 |
| a single-cell transcriptome atlas profiles early organogenesis in human embryos | nature cell biology | 21.3 | 2023 |
| implantation underneath the abdominal anterior rectus sheath enableseffective and functional engraftment of stem-cell-derived islets | nature metabolism | 20.8 | 2023 |
| integrated single-nucleus and spatial transcriptomics capturestransitional states in soybean nodule maturation | nature plants | 18 | 2023 |
| deciphering spatial domains from spatially resolved transcriptomicswith an adaptive graph attention auto-encoder | nature communications | 17.694 | 2022 |
| spatially resolved gene regulatory and disease-related vulnerability map of the adult macaque cortex | nature communications | 17.694 | 2022 |
| spatial-id: a cell typing method for spatially resolved transcriptomics via transfer learning and spatial embedding | nature communications | 17.694 | 2022 |
| single-nucleus rna sequencing and spatial transcriptomics reveal the immunological microenvironment of cervical squamous cell carcinom | advanced science | 17.521 | 2022 |
| spatially informed clustering, integration, and deconvolution of spatial transcriptomics with graphst | nature communications | 16.6 | 2023 |
| spatiotemporal mapping of gene expression landscapes and developmental trajectories during zebrafish embryogenesis | developmental cell | 13.417 | 2022 |
| high-resolution 3d spatiotemporal transcriptomic maps of developing drosopbila embryos and larvae | developmental cell | 13.417 | 2022 |
| the single-cell stereo-seq reveals region-specific cell subtypes and transcriptome profiling in arabidopsis leaves | developmental cell | 13.417 | 2022 |
| spatial transcriptome analysis on peanut tissues shed light on cell heterogeneitw of the peg | plant biotechnology journal | 13.263 | 2022 |
| spatial transcriptomics reveals light-induced chlorenchyma cellsinvolved in promoting shoot regeneration in tomato callus | proceedings of the national academy of sciences of theunited states of america | 11.1 | 2023 |